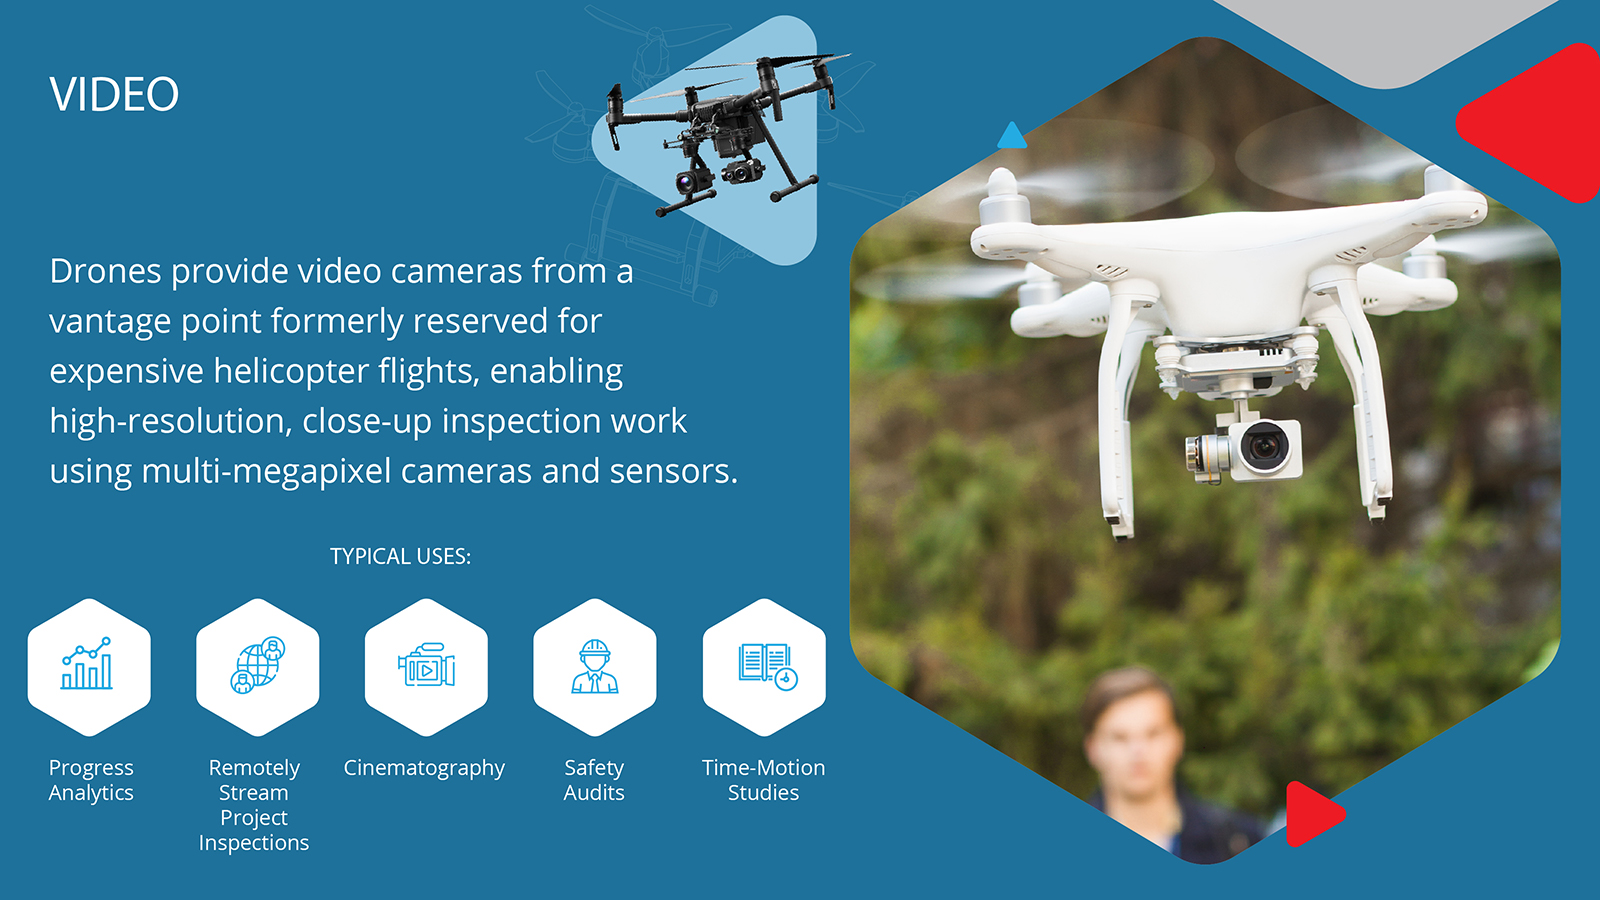
For the last 6 years or so the world has witnessed how incredible drone camera technology has generated super-high-resolution images and stunning aerial video in 4K resolution and captured at up to 60 frames per second quality. These two data types have catapulted the drone industry initially in Real Estate and aerial cinematography.
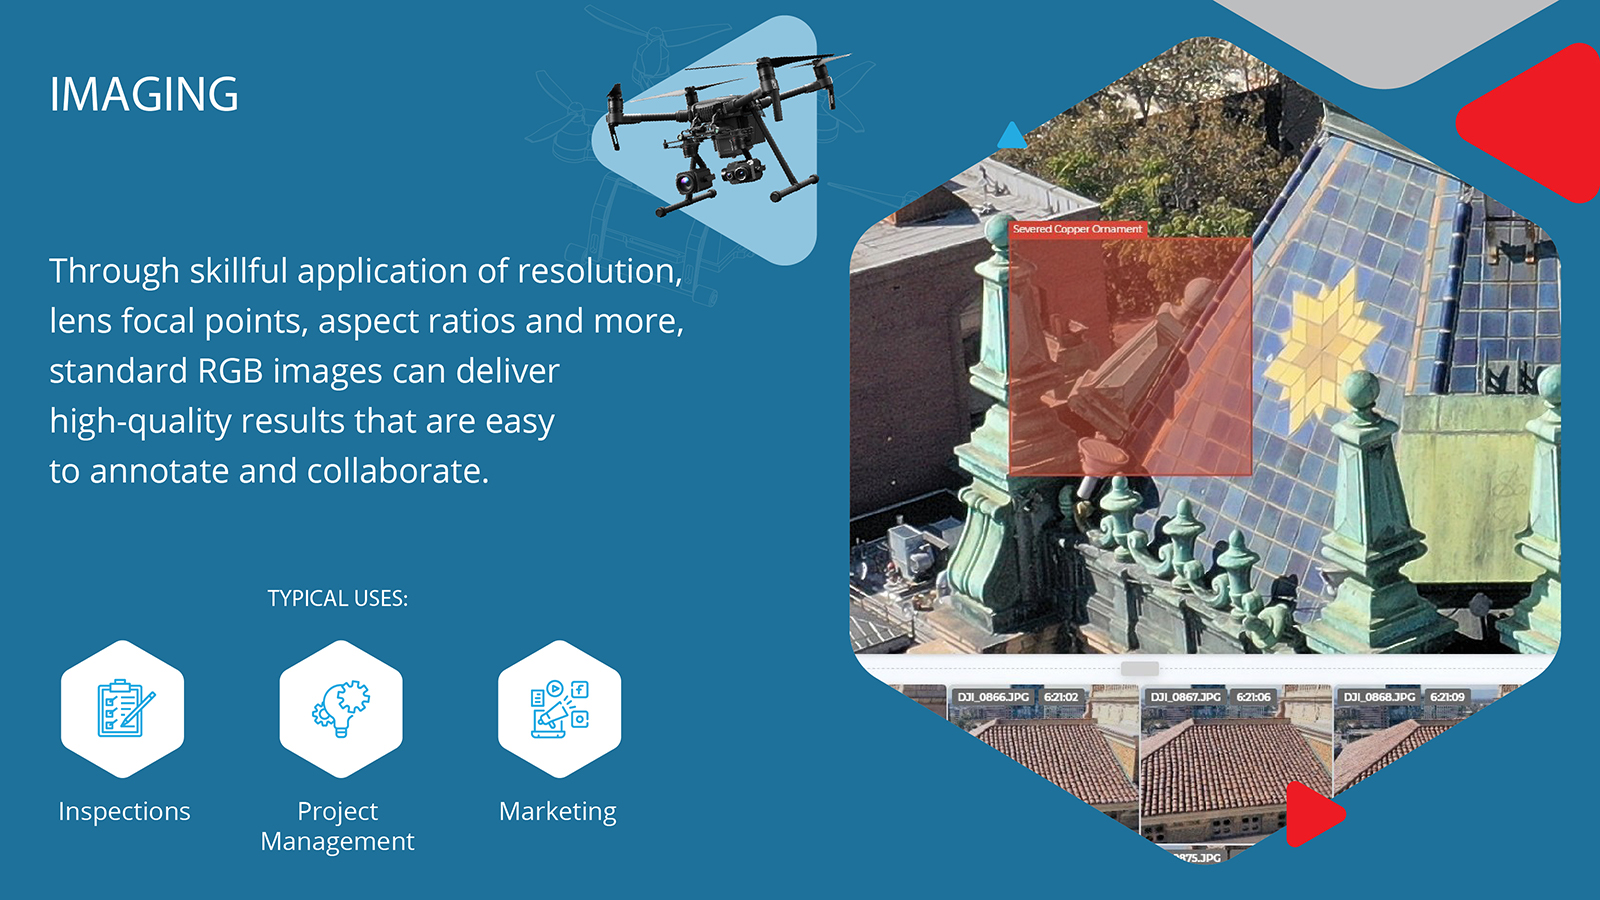
Advancement in specialized sensors and software platforms, drones can now generate much more than just cool pictures and video. Today, drones have the ability generate a wide range of data types which are proving to be useful for an even greater number of industries, including:
Drones can generate a range of data types, so how is the drone industry collecting, packaging, and delivering drone data to the end-user so it is easy to understand and consume?
First, it is important to understand some common drone data types that are typically produced for the commercial end-user. Here are some of the most widely used drone data types and how they are used in various applications.
Although point cloud technology has been around for decades, it has only recently come to the forefront with the advent of drones.
A point cloud data set is essentially the simplest form of a 3D model. It is a collection of millions of individual points plotted in a 3D space. Each point contains several measurements, including its coordinates along the X, Y, and Z axis.
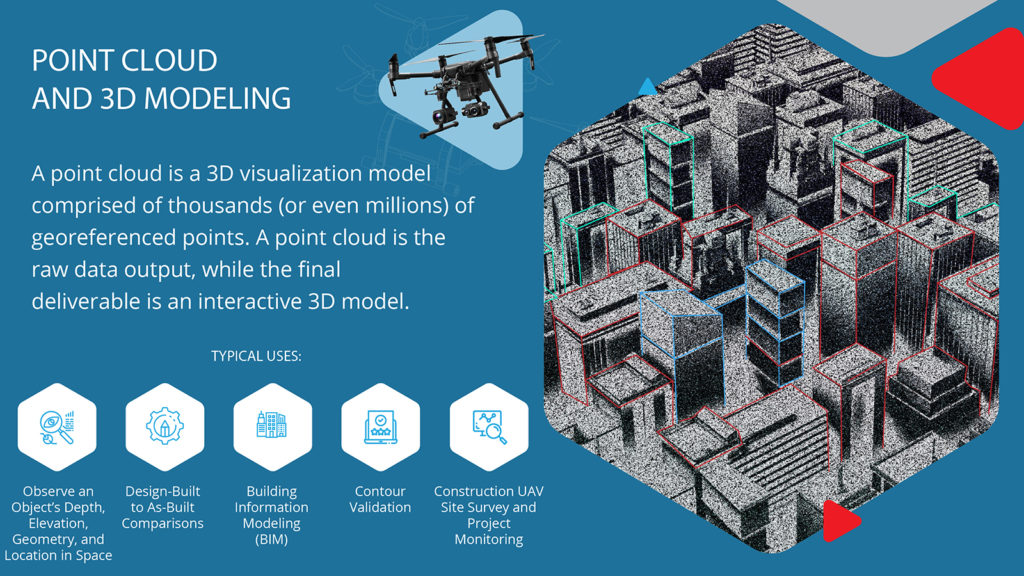
Sometimes it includes additional data, such as color value (which is stored in RGB format) and luminance value (which determines how bright the point is).
Point clouds are created by performing a scan of an object or structure. Scans are completed by either using LASER technology or through a process called photogrammetry. The laser process works by sending out pulses of light to the surfaces of an object and measuring how long it takes each pulse to reflect and hit the scanner. These measurements are used to determine the exact position of points on the object.
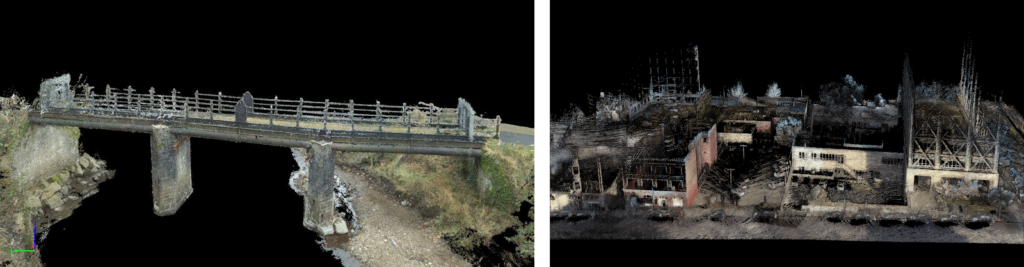
Point cloud photogrammetry, on the other hand, is the process of creating measurements from geo-referenced pictures. It uses images of an object taken at different locations to triangulate points on the object and plot these points in a 3D space.
The primary purpose of a point cloud is to create a 3D model which can be experienced as a texture, especially if the points have color and luminance values. But often the point data is first converted into a polygon mesh because most 3D modeling software programs work with polygons.
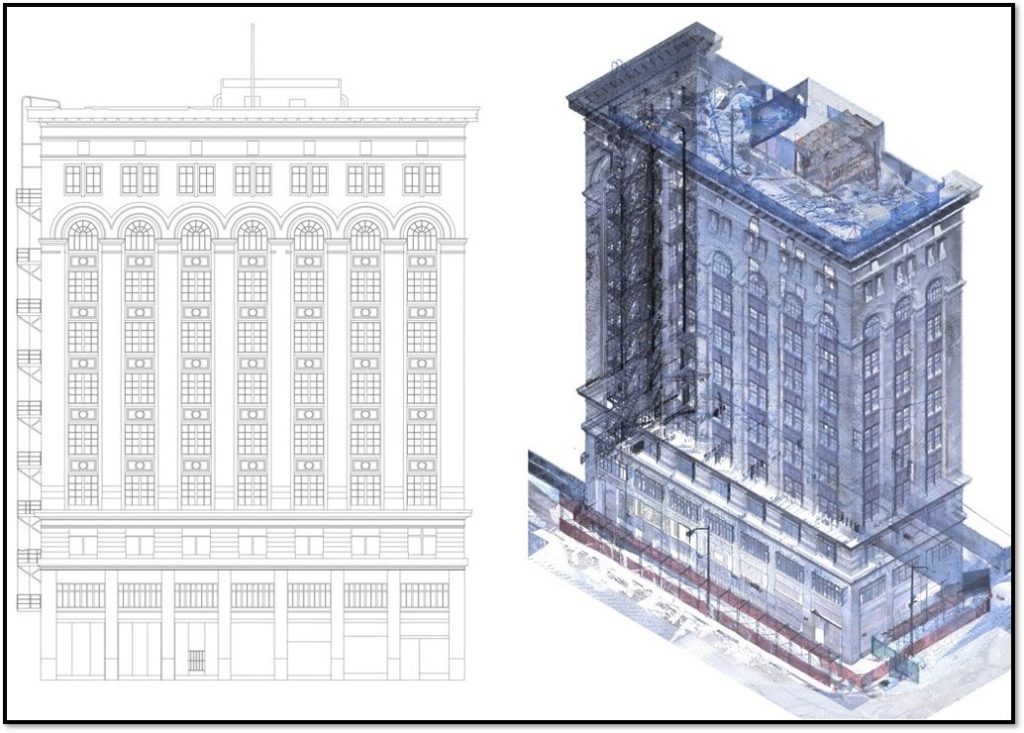
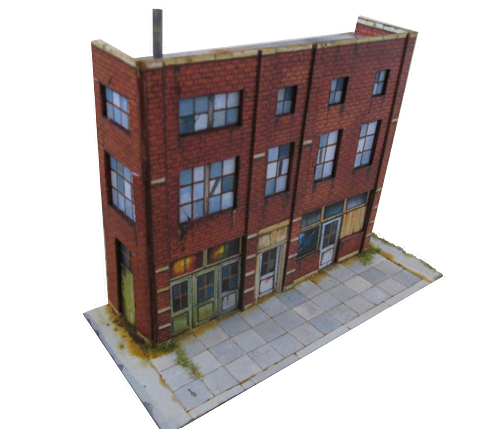
The accurate 3D models formed by point clouds are used in a variety of ways across different industries. In the architecture engineering and construction industry, 3D models help produce as-built drawings and models which capture the current conditions and layout of buildings, infrastructure, and topographical conditions.
The accuracy of the 3D models means they can be used for measuring distance, area, and volume, which is beneficial for construction and restoration projects. The accuracy of the 3D models also means they can be used to calculate distance area and volume measurements, which means it can be imported into CAD programs for refining and manipulating the design of the object.
One of the reasons that point clouds are a popular format for 3D models is because of something called the “Point Cloud Library”. This is an open-source framework, which includes algorithms and tools for manipulating and refining point cloud data.
Drones are essentially airborne scanners that can be used to turn large objects such as buildings, construction sites, or large land areas into 3D models because of a technology called photogrammetry.
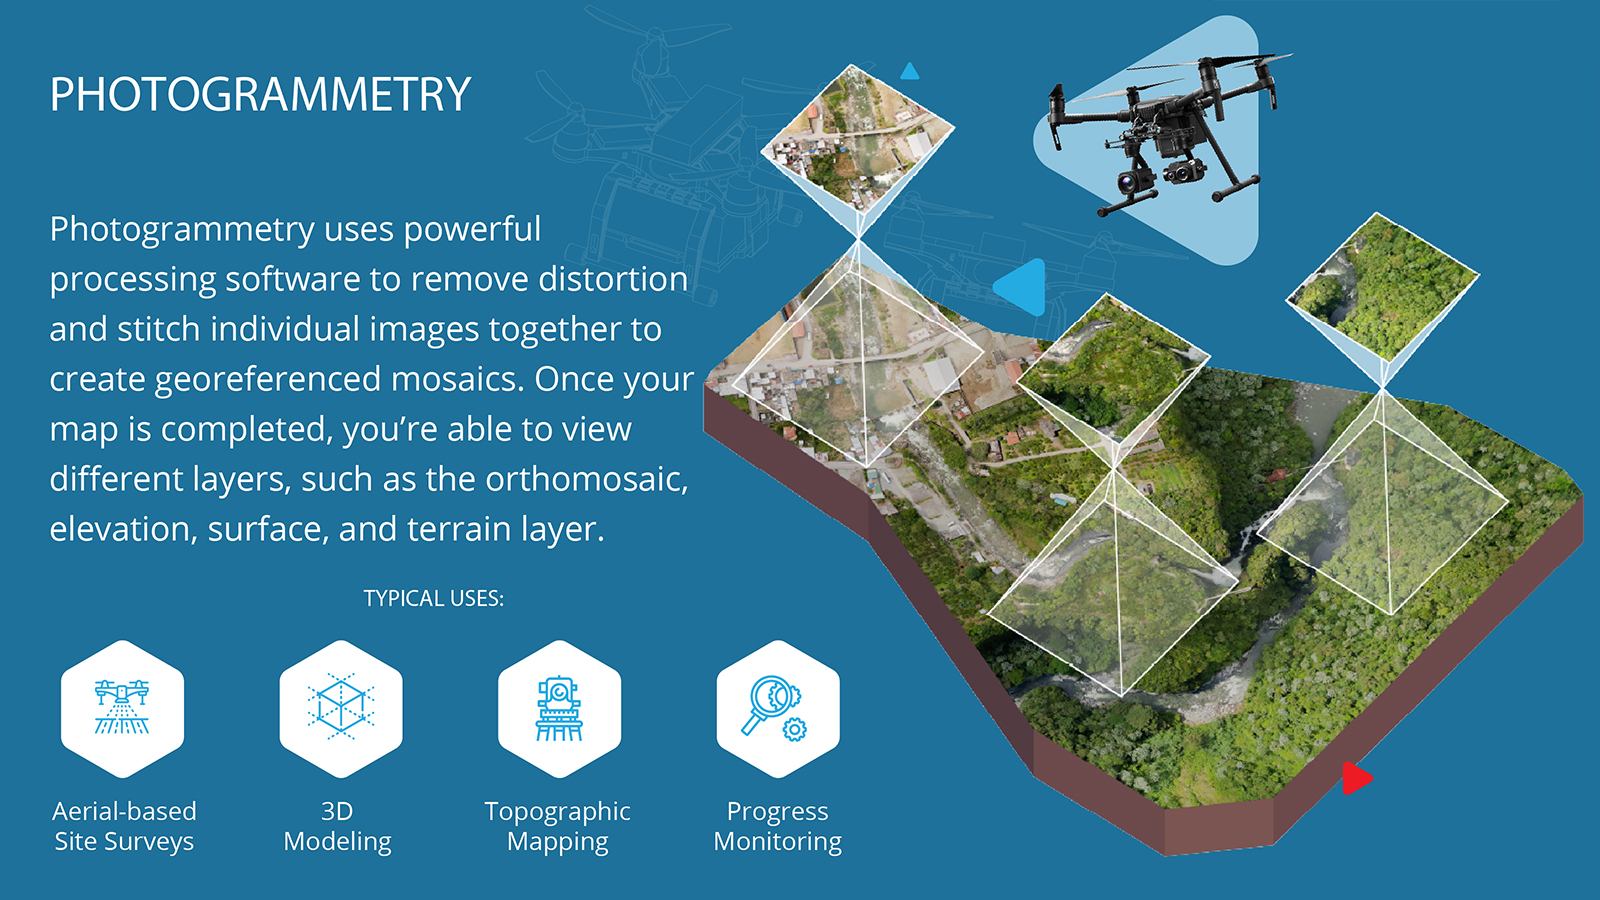
Photogrammetry is the science of capturing measurements from photographs, particularly aerial images. Photogrammetry works by looking at images of a subject taken from two or more locations. It uses different perspectives of the images along with the location data of where the images were taken to triangulate the locations of points on the subject. This is the same process Google Maps uses to stitch together satellite photos to make one seamless view.
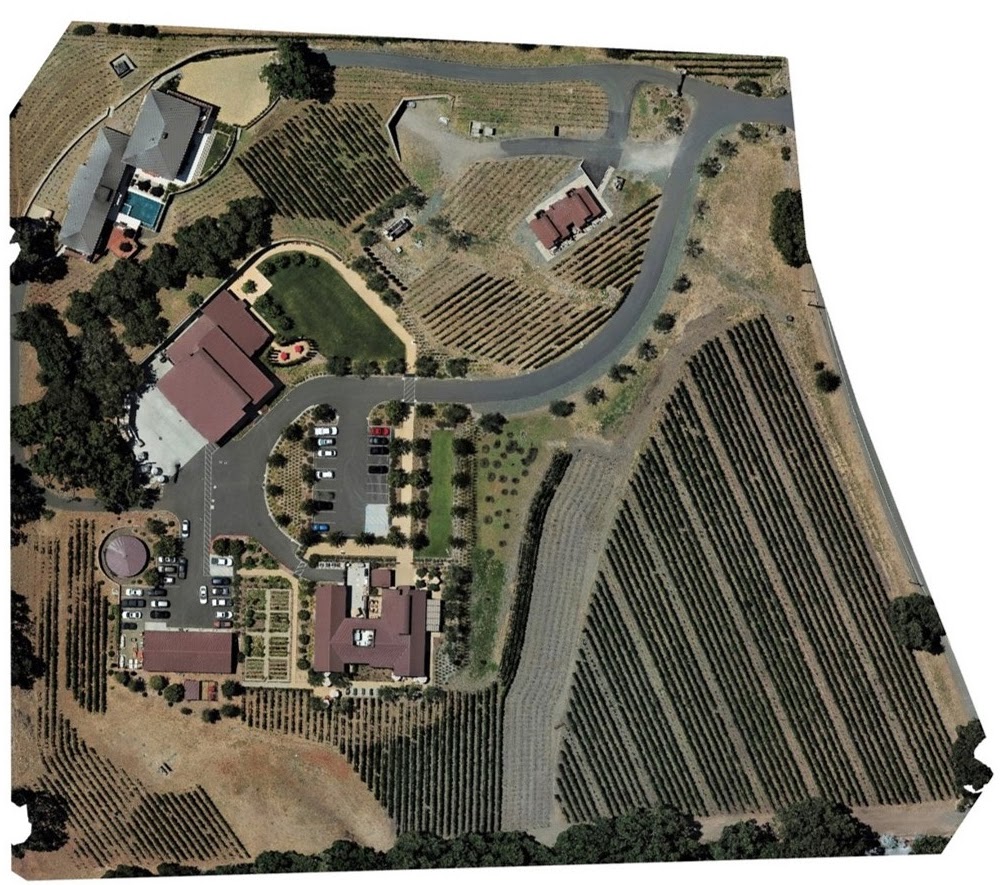
The more photos you have of your subject taken from different locations, the more accurate this triangulation process will be. The result is accurate point locations plotted in 3D space, which is exactly what you need to create a 3D model. Drone images are ideal for this process because every image is geo-tagged. This means the latitude, longitude and altitude from the drones GPS and onboard sensors, are embedded in the metadata of the image. The metadata also includes information about the camera sensor and the optics of the drone. These geotagged photos can be processed by software programs such as DroneDeploy, Pix 4D, and other platforms to create 3D models with high detail and accuracy.
To deliver the highest accuracy for a 3D drone-generated model there needs to be a minimum of 60 to 70% overlap between aerial photos. This helps the triangulation process be more accurate and track the same points between images. Sophisticated drone flight software applications, such as Measure, DroneDeploy, and Pix 4D play a crucial role in capturing and creating automated flight plans and setting the desired image overlap.
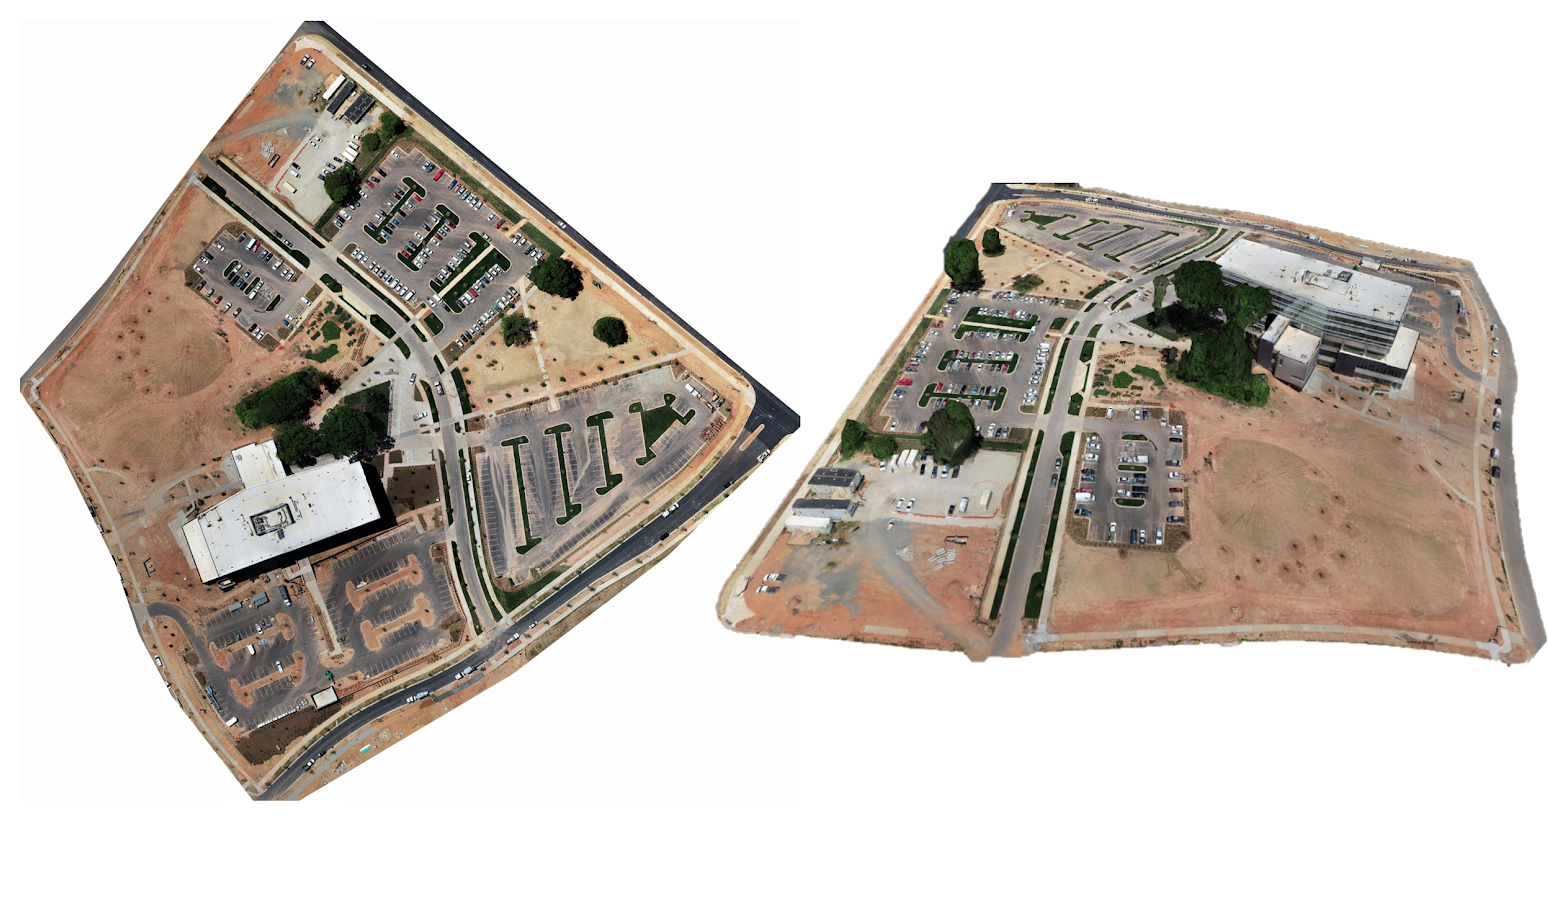
To achieve the best quality and results, it’s also important to capture images at different angles and altitudes. For example, first flying a NADIR flight (straight down view), from around 150 to 200 feet. Then that is followed up with an orbital flight around the subject with oblique angles from a few different altitudes (example):
Part of getting a higher quality deliverable is to ensure the orbit radius is configured to keep the focal subject in the frame. Capturing these different angles and altitudes helps create a higher quality 3D model by providing texture and image data of all the sides of a building as well as the top.
These comprehensive 3D models are already being successfully used in a number of industries. The construction industry, in particular, has seen a huge benefit from using drone imagery mapping and 3D modeling to monitor the progress of construction sites. By replicating flight plans using software platforms, it’s possible to efficiently create digital twins to easily inspect changes at different areas on the site.
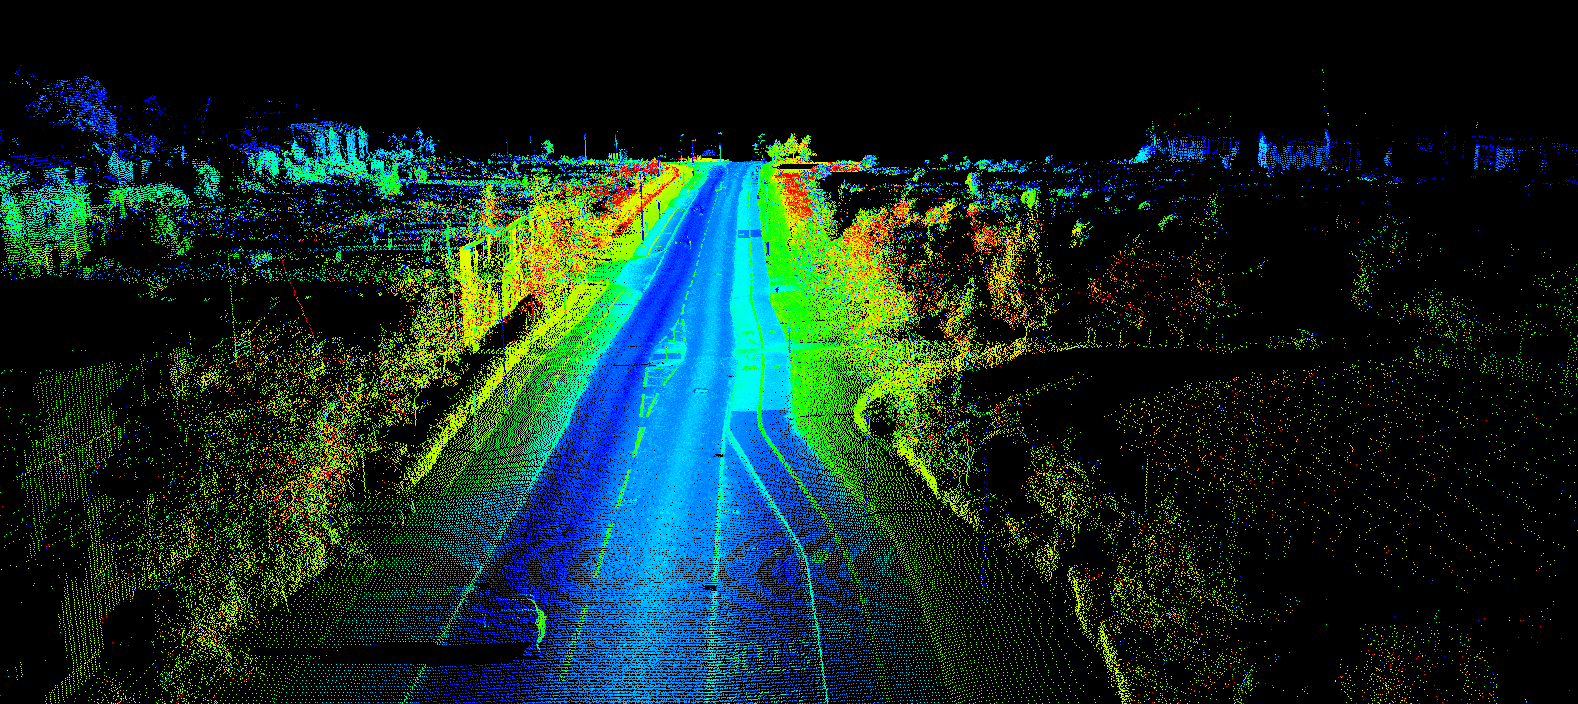
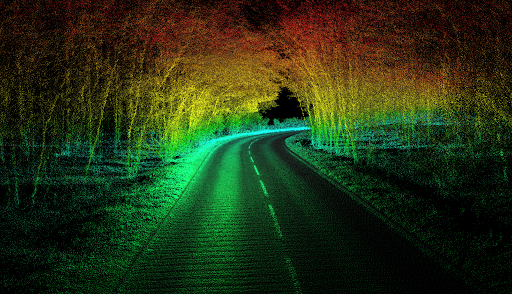
LiDAR or light detection and ranging uses lasers to measure the elevation of things like the ground force and even buildings. It is a lot like sonar, which uses sound waves to map things, or radar, which uses radio waves to map things. But a LiDAR system uses light sent out from a laser. There are different ways to collect LiDAR data- from the ground, from an airplane, or even from a drone.

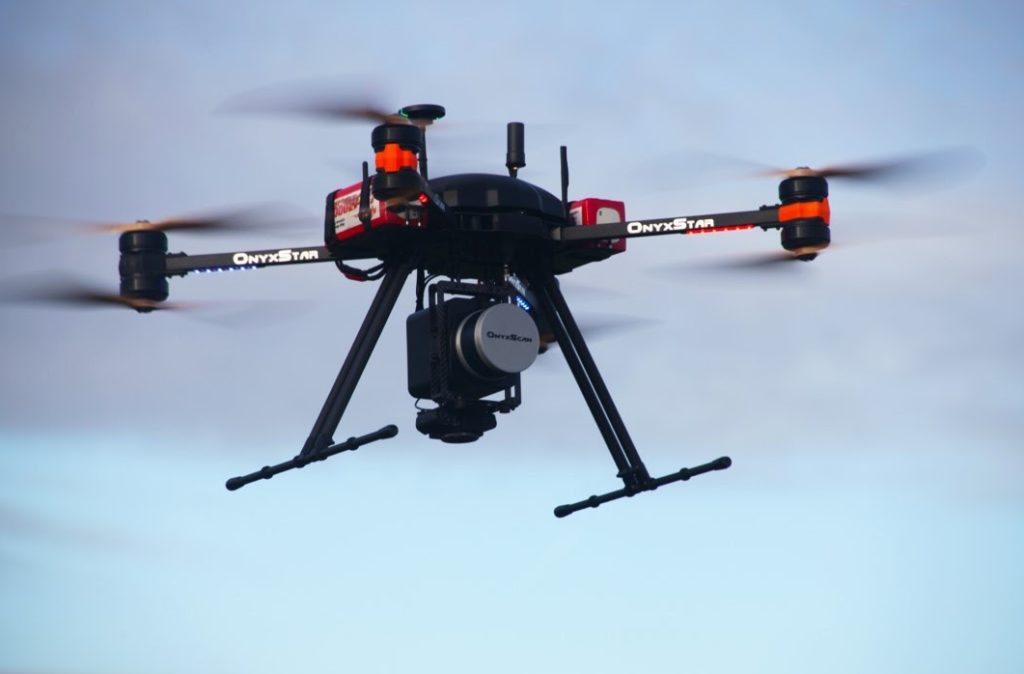
There are 4 parts to a drone LiDAR system. First, the drone contains the LiDAR unit itself, which uses a laser to scan the earth from side to side as the drone flies. The laser sensor uses either green or near-infrared light because these wavelengths or types of light reflect strongly off vegetation, which is why LiDAR is so valuable when mapping terrain with much vegetation canopy.
The next component of a LiDAR system is a GPS receiver that tracks the altitude and X-Y location of the drone. The GPS allows us to figure out where lighter reflections are on the ground.
The third component of a LiDAR system is what is called an inertial measurement unit or IMU. The IMU tracks the tilt of the drone as it flies, which is important for accurate elevation calculations.
Finally, the LiDAR system includes an onboard computer which records the height information that the LiDAR collects as it scans the earth’s surface.
So how does the laser, GPS, IMU, and the computer all work together to get us these incredibly useful LiDAR datasets?
First, let us define the word pulse. A pulse refers to a burst of light energy that is emitted by the LiDAR system. And second, let us define the word return. Return refers to reflected light energy that has been recorded by the LiDAR sensor. So, pulses of light energy travel to the ground and return to the LiDAR sensor. To get height, the LiDAR system records the time that it takes for the light energy to travel to the ground and back.
The system then uses the speed of light to calculate the distance between the top of that object and the plane. To calculate ground elevation, we take the altitude of the drone from the GPS then we subtract the distance that the light traveled to the ground.
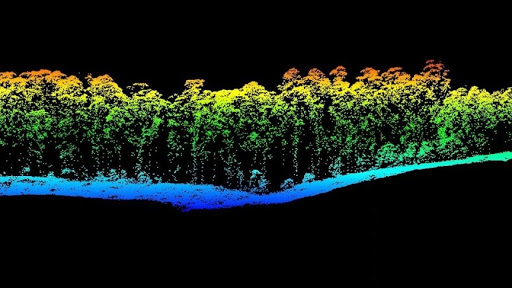
There is one more component of a LIDAR system that makes it so useful. A pulse of light does not just reflect off one thing, such as the top of a tree, and yield one return. Sometimes a LiDAR pulse travels through objects, such as within the gaps between tree branches and leaves. Think about standing on the forest floor and watching the sunlight filter through the tops of the trees making the leaves and branches glow. Light energy that passes through the trees reflects off the branches and leaves within the canopy. This ability of LiDAR to travel through and record information—starting from the top of the canopy, through the canopy, and all the way to the ground—makes LiDAR systems unique and highly valuable.
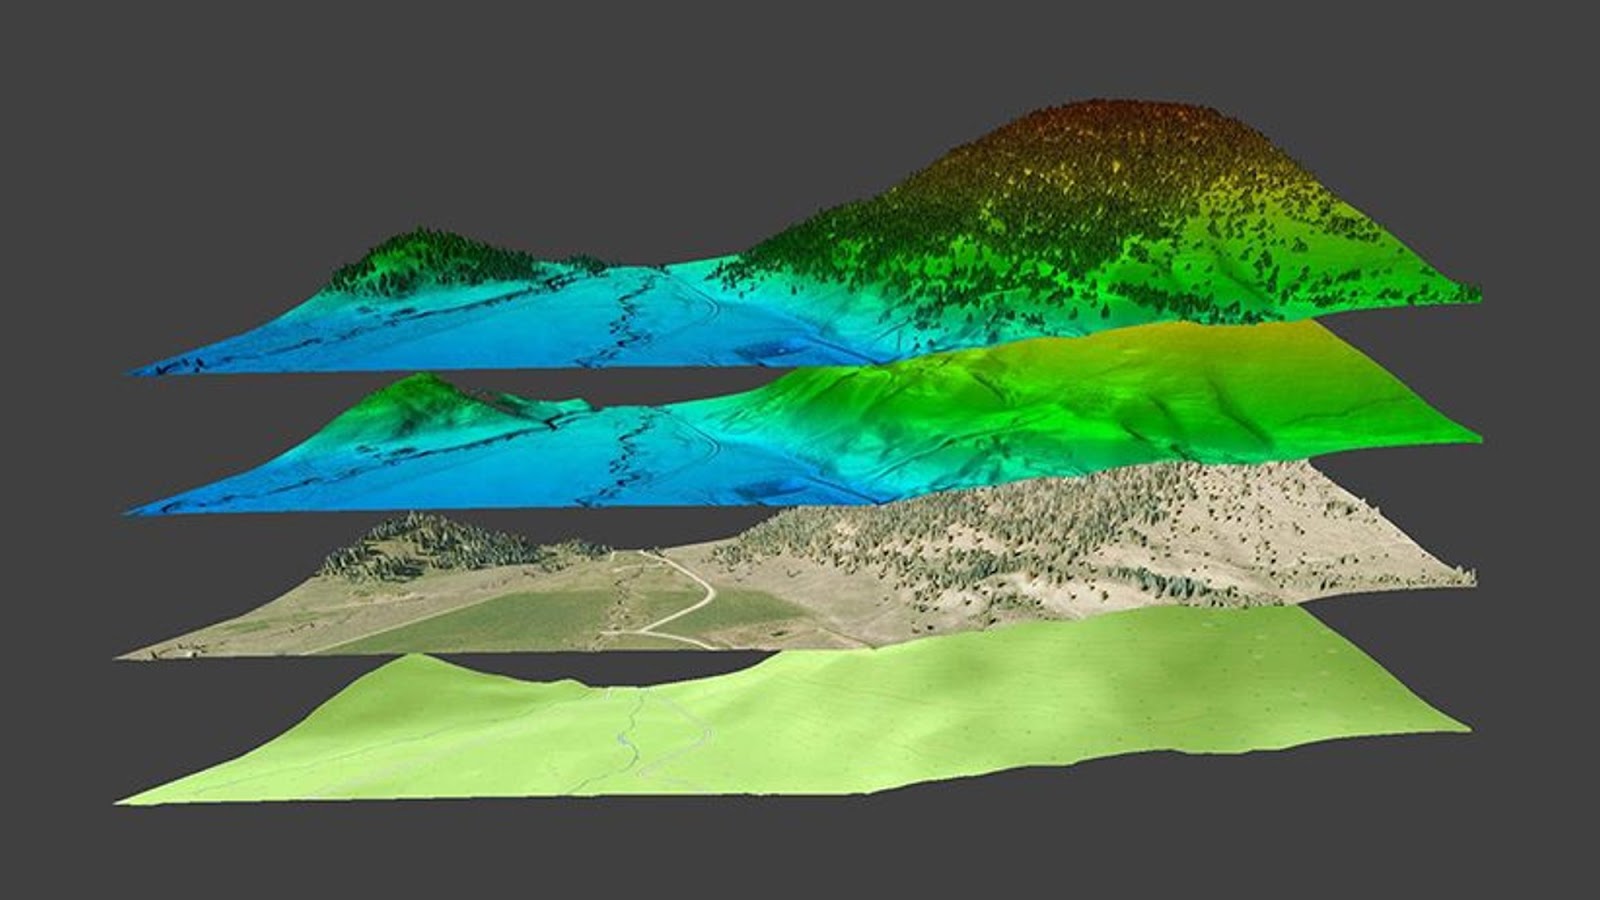
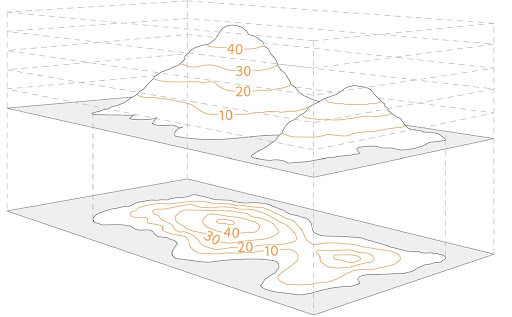
When we talk about topographical data, we typically reference all the datasets into what’s referred to as an “Elevation Layer”.
Elevation layers generally consist of a digital surface model (DSM), a digital terrain model (DTM) or contours (as it’s referred to in the surveying world).
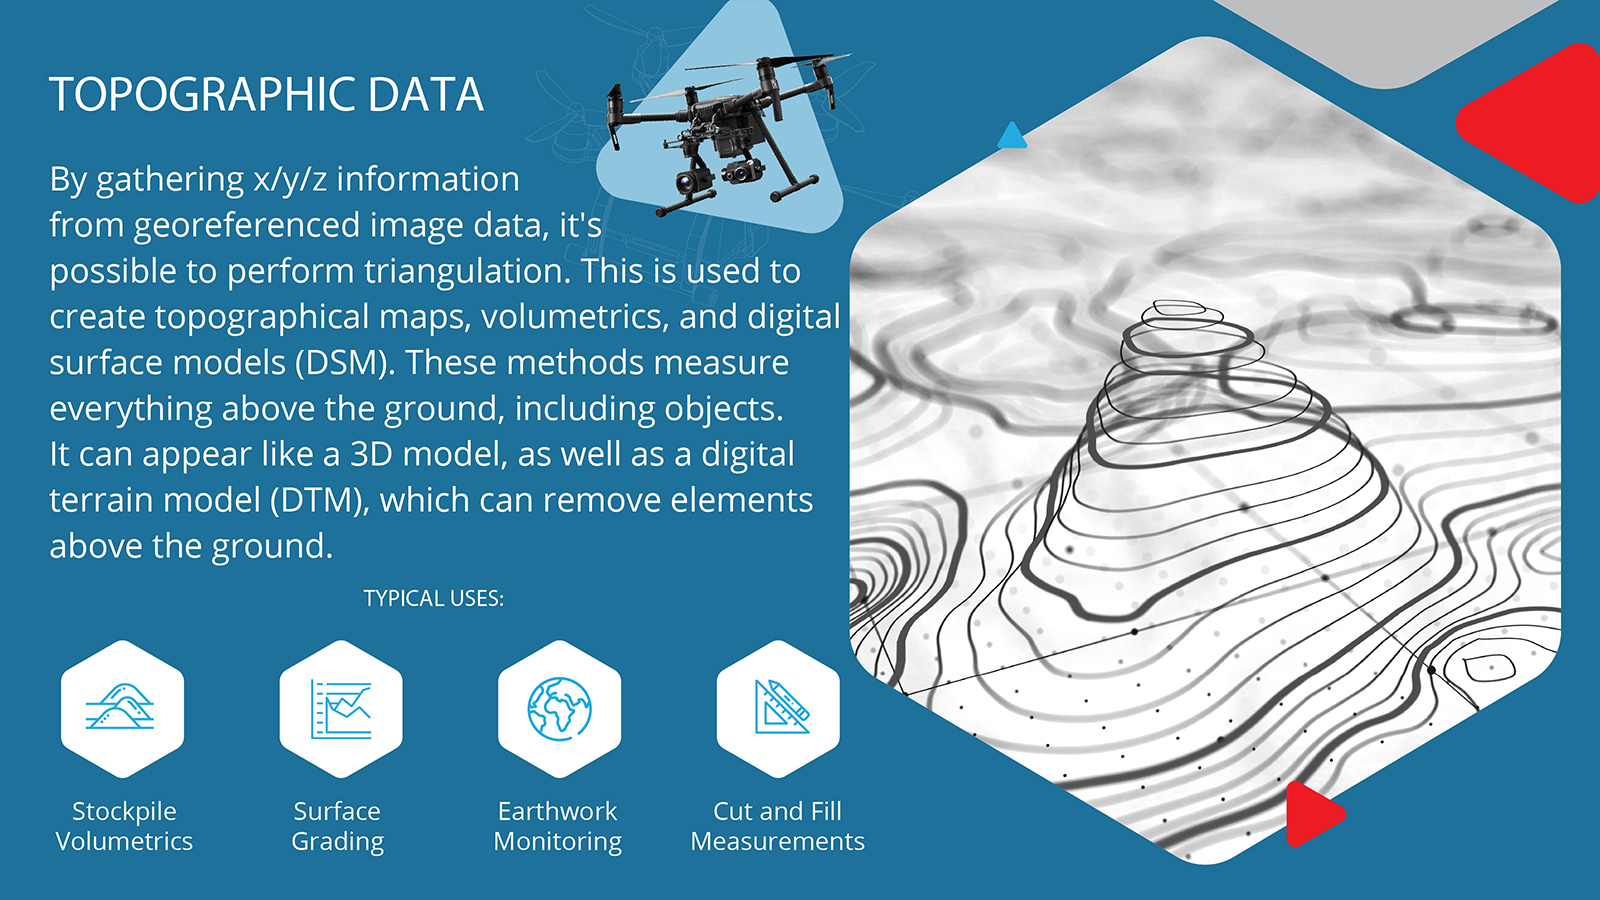
Those that use elevation data mostly use digital surface models. It’s the typical default in most software processing platforms, and will display heights of all objects within the map.
Additional tools within the layer will allow you to explore the data even more deeply through a perspective of the elevation and depth of each area of the map.
The elevation data on the map is taken from geospatial information embedded in your drone images and automatically generated when you process imagery into a map.
Platforms like DroneDeploy provide helpful tools such as “elevation profile” which is useful to:
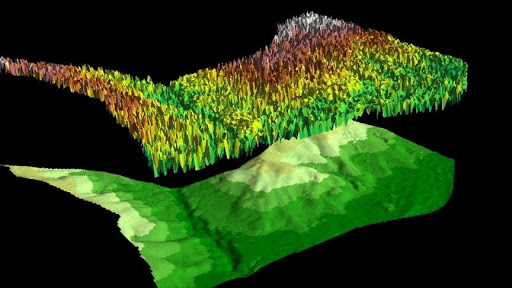
The elevation data captured by a drone includes all the surfaces it sees, including trees, equipment, and other structures. This elevation is called the Digital Surface Model.
However, if you want to remove these obstructions so that they can understand the terrain beneath when designing a project, estimating the earthmoving required, or measuring volumes of materials on-site, it’s now possible to do this by using the Digital Terrain Model (DTM) for elevation.
Accuracy is critical. Poor accuracy on a construction site, for example, means poor comparisons of actual work completed versus the design, as well as provides only a poor understanding of where activity needs to take place. In industries such as mining or earthwork, it means that the tonnage being planned for is not the tonnage they extract. This can lead to financial impact where they have either too much stock or too little stock.
In the surveying industry, for example, if you are working on a landfill, or a construction site, they all have specific coordinate systems that they operate in, sometimes their state plane, like they are tied to the state that you are in. Sometimes they are local, like they have been established by a surveyor, either at that time or in the not-so-distant past and therefore it does not really tie into anything else.
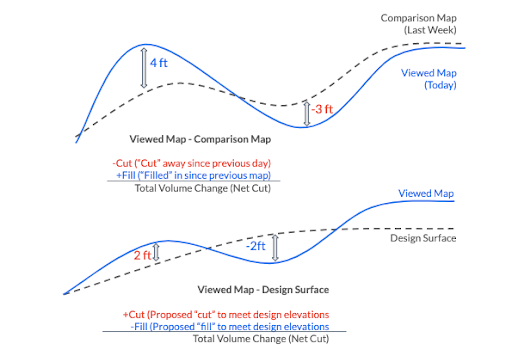
The cut/fill comparison concept allows you to quickly compare the elevation of one map to another map or to a design surface (grading plan). With heatmap visualization, you can easily identify where soils have been cut or filled from one map to another or how much soil needs to be cut or filled to reach design grade so that you can track changes and monitor the progress of earthmoving. With volume measurement comparison, you can quantify the amount of earth moved—either for an entire site, or for individual volume measurement, like a pit or stockpile—so that you can verify subcontractor work, manage stockpile inventory, and better keep to a project schedule.
In the diagram below, when comparing it to a design plan, cut and fill are expressed in terms of what would need to be cut or filled to match the later state or design plan. You can think of this as “proposed cut” and “proposed fill”. For example, areas, where my map is higher than the design plan, would be colored red for “cut”, meaning that earth would need to be “cutaway” to reach design elevations.
This visual is a good representation of this.
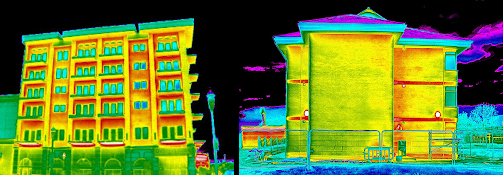
Thermal cameras allow us to see and understand the invisible thermal or infrared energy that is around us all the time.
Infrared energy is part of the electromagnetic spectrum. We don’t think about it because it is invisible to the naked eye, except for a tiny slice in the middle of the spectrum, which we call visible light.
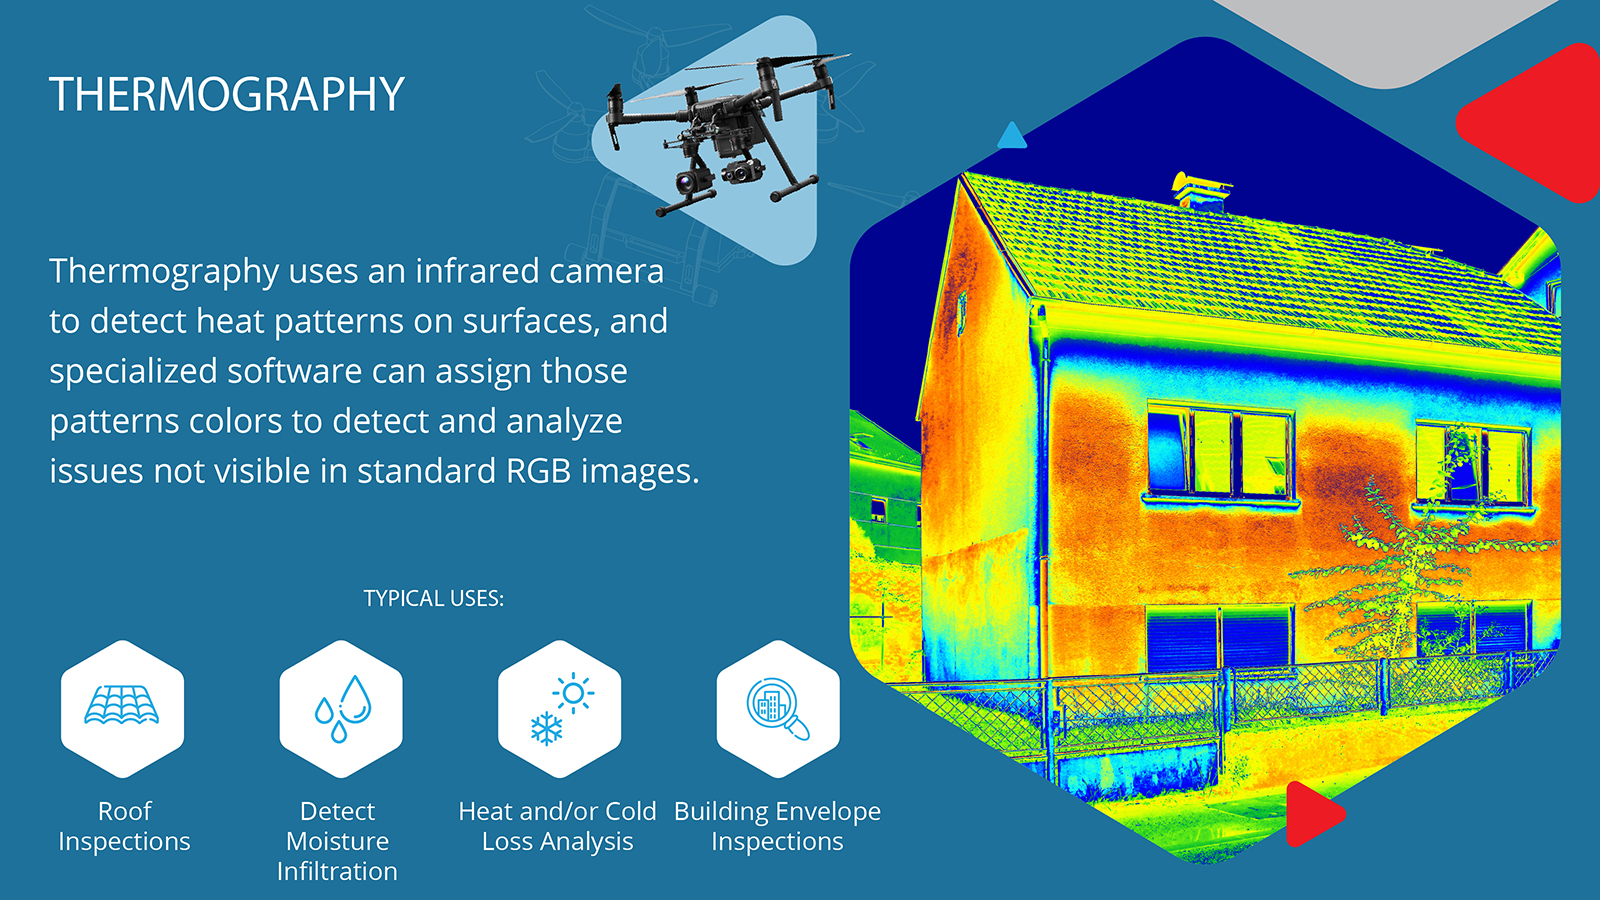
Even though it is all light energy, visible light and thermal energy do not always act the same. The human eye sees the light that has reflected off a surface in different wavelengths, creating color differences that we can see.
But thermal energy does not work that way, it can be emitted (radiated) or reflected visible light passing right through the glass. Not only will most of the energy you will see from a drone be emitted or reflected, but it can also even be both at the same time.
When we talk about how efficiently an object gives off thermal energy, we are referring to the emissivity that varies based on what the objects are made of, and their surface condition. People, animals, concrete, trees, and rocks have high emissivity, so they give off their energy very efficiently. Materials such as shiny metals, for example, typically have a low emissivity, so they are reflective.
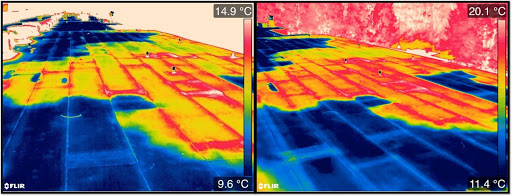
But a metal’s emissivity can change if it is corroded or painted. When two objects are close in temperature but have different emissivity, they can appear vastly different to a thermal camera.
Thermal imaging is largely a surface phenomenon. See these two thermal images below, which are from the same roof. They are made of the same metal material, but the section on the left is new and has not been painted yet, so it is reflecting the cold sky.
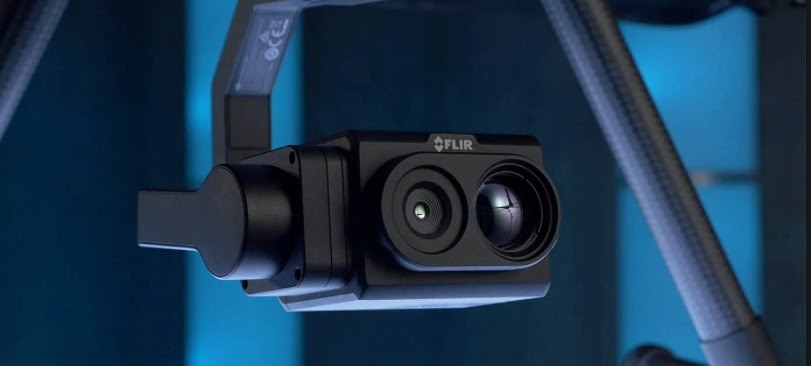
Thermographers have been using handheld thermal cameras to inspect commercial roofs for decades. Industry leader FLIR has revolutionized just about every aspect of the technology of thermographic imaging. Today with drones that used to take hours or even days can now be done in a matter of minutes.
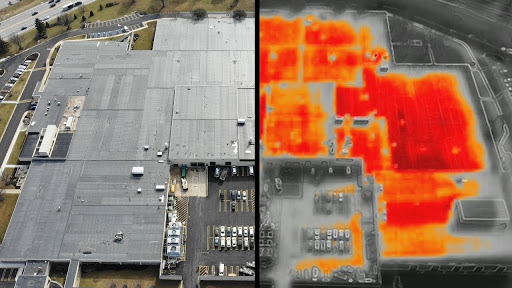
Drone missions that generate thermographic imaging are not just for finding problems. Most people who think of roofs are focused on just finding damage in the existing structures. Drone thermography is also a powerful tool for performing baseline surveys to confirm the proper installation of roofing materials on new buildings or in rebuilt roofs. In addition, not all thermal anomalies are repair issues. Different roofing materials and different weather patterns can produce different thermal signatures that may look like water under the membrane—but really are not.
But just because it is more efficient, does not mean it is as easy as point-and-shoot. As with most technologies that seem too good to be true at first, there are a few elements you need to keep in mind.
As you can see, drones have moved well past aerial photography and videography, and are now providing essential data, insights, and workplace safety to many important industries, including construction, architecture, surveying, property damage assessment, roof work, building facade inspection, and much more.
As data sensor technology continues to evolve at a rapid pace, drones are always at the ready to take them to the sky.

Frank Segarra is the Senior Vice President of Sales at Volatus Unmanned Services. He has over 30 years of IT, telecommunications and aviation industry experience and was a US Navy aircraft carrier airman specializing in Avionics Engineering. As a thought leader in drone technology, Frank was invited to be a founding member and CompTIA Drone Advisory Council. and is on the Board of Advisors for the PA Drone Association.
Find out what you need to know when hiring a drone service, and learn about creative ways that different industries use drones to improve data, reduce risk, and achieve business objectives.